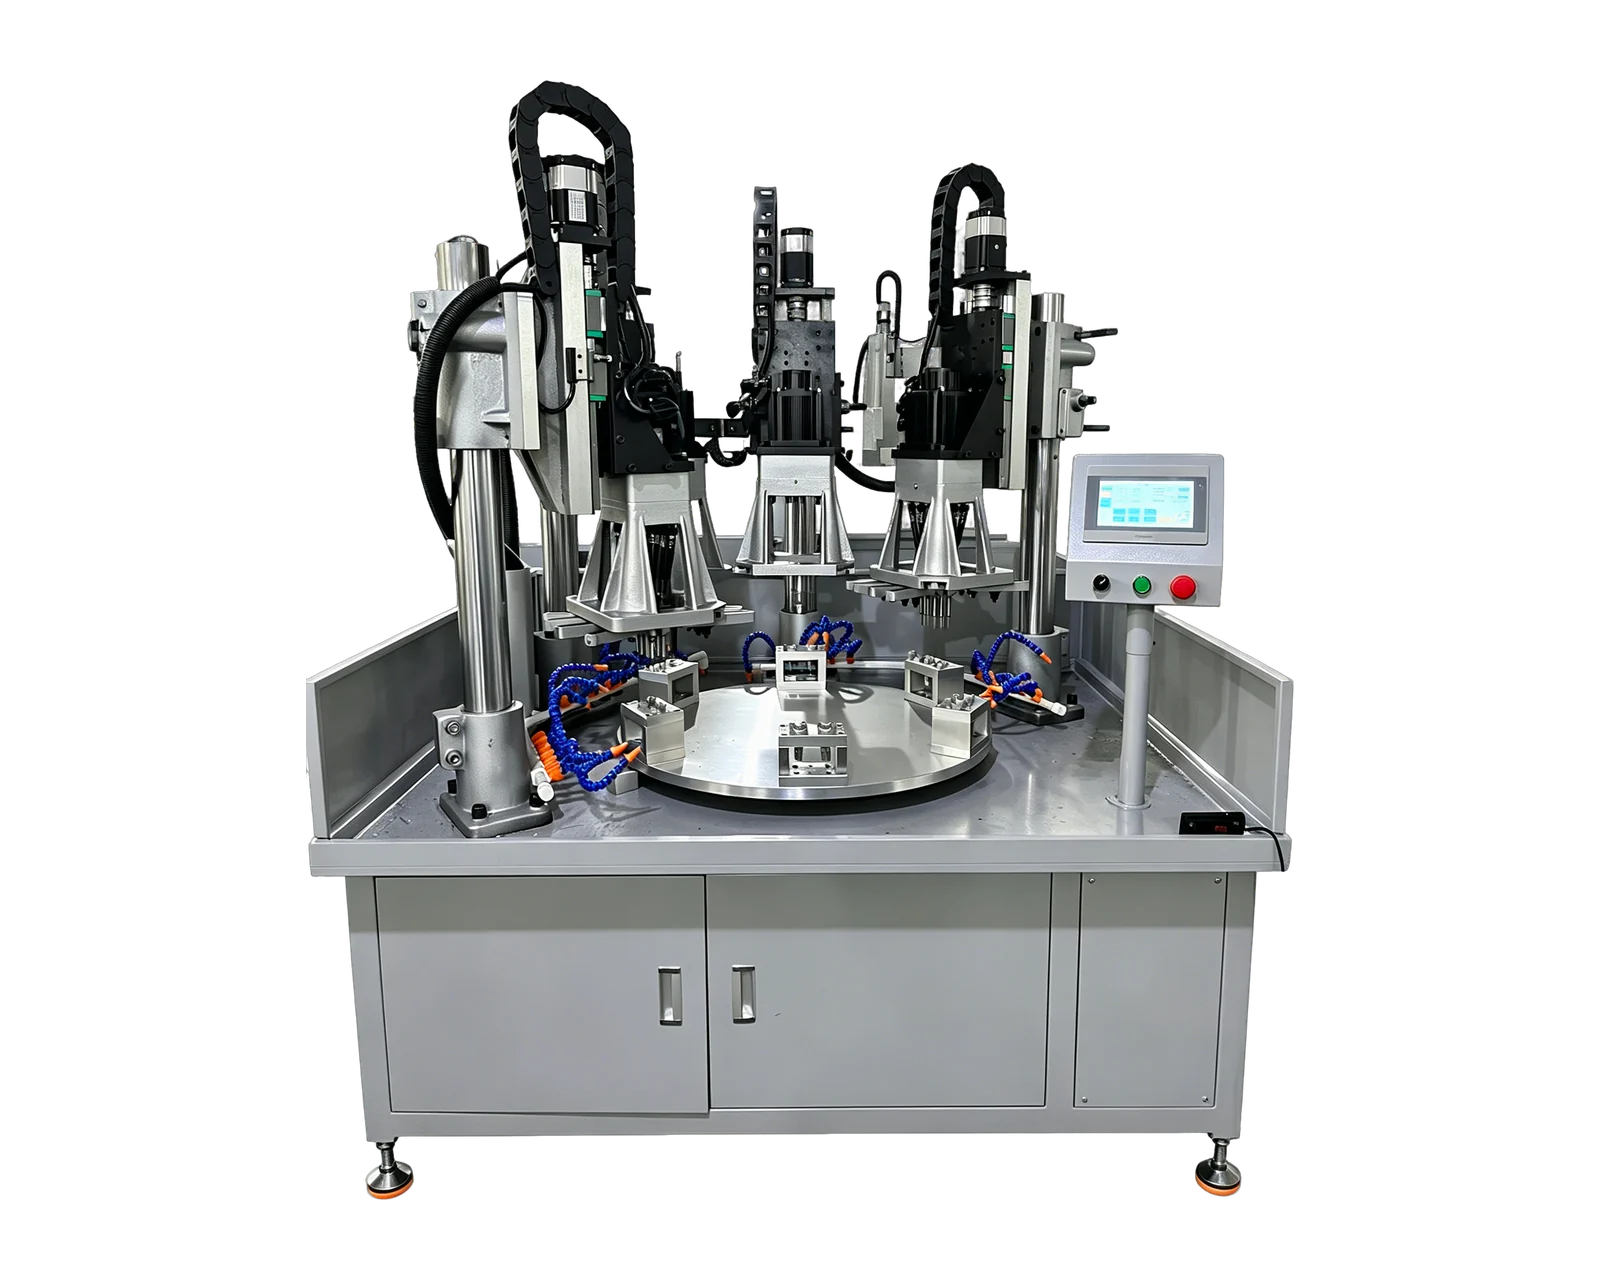
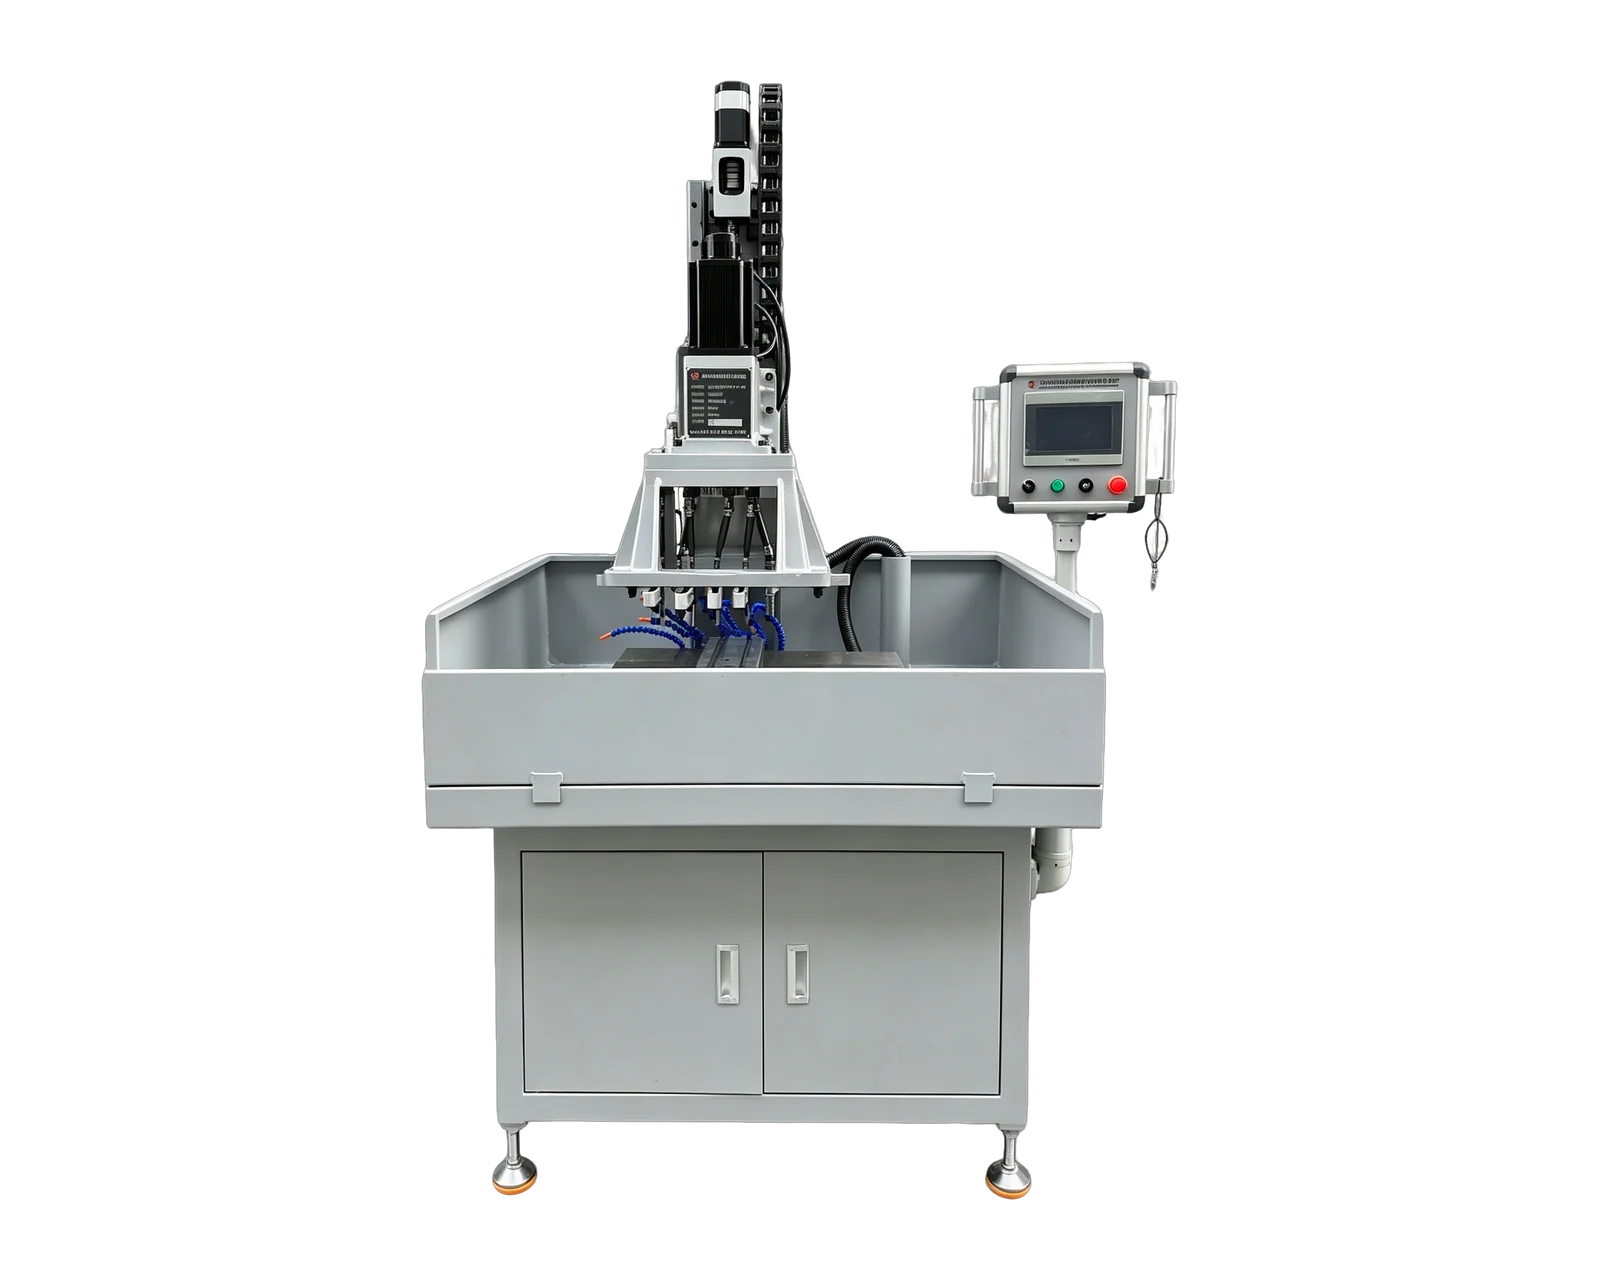
Explore equipment for your inquiry
Dual-Servo Multi-Spindle Drilling & Tapping Machine →Review the published specifications and configuration options against your part drawing before requesting a quote.
Separate sample conformance from a process claim
A report saying every inspected hole passed answers a question about those observations. A proposal promising process capability makes a broader claim. Ask which characteristic, operating conditions and production interval the claim covers. A diameter result cannot stand in for thread acceptance or hole position, and a successful demonstration on one tool does not automatically cover its replacement.
NIST describes capability as a comparison between a stable process and specification limits, with distributional assumptions behind the familiar normal indices. Accordingly, ask for a time-ordered stability assessment and a justified analysis method before treating an index as predictive. An unstable series can be summarized, but its summary is not assurance that tomorrow's process will behave the same way.
Name the standard deviation, not just the index
Minitab distinguishes Cpk calculated with a within-subgroup standard deviation from Ppk calculated with the overall standard deviation. For a two-sided normal analysis, both take the smaller of the upper and lower distances from the mean, divided by three times the relevant standard deviation. Overall variation describes all observations collected; within variation depends on the subgroup design and estimation method.
In that framework, a rational subgroup collects observations made under comparable conditions close together in time. It is not a collection of whichever readings happen to be similar. Request the actual subgroup identifiers and estimation settings. Do not rearrange a completed series to improve its index, or call a Ppk result long-term merely because the software prints that label. The observation period still determines its coverage.
An invented example shows why the same mean is insufficient
This original arithmetic illustration uses no production measurements. Assume diameter limits of 9.950 and 10.050 mm, a mean of 10.010 mm, a supplied within standard deviation of 0.008 mm and a supplied overall standard deviation of 0.012 mm. The two deviations are hypothetical inputs, not estimates calculated from a hidden sample. No subgroup count, stability conclusion or confidence interval is implied.
The nearer limit is 0.040 mm from the mean. Using the normal-index formulas gives Cpk = min(0.040, 0.060) / (3 × 0.008) = 1.67 after rounding; Ppk = min(0.040, 0.060) / (3 × 0.012) = 1.11. These are arithmetic outputs, not passing or failing grades. Their difference invites questions about the supplied variation estimates; it does not diagnose tool wear or validate the assumptions.
Put an analysis brief beside the drawing
Use the following original template when asking for an evidence-based trial proposal. Its fields describe the statistical deliverable rather than another machine commissioning checklist. The quality owner should determine the sample size from the decision, uncertainty and operating coverage required. A universal sample count or index threshold is not supplied here.
Do not let a larger spreadsheet hide a different process
For a multi-spindle proposal, state whether each hole stream is evaluated separately and what justifies any pooled result. Combining distinct nominal sizes or treating several correlated holes on one part as independent parts can change the question being answered. Preserve hole, part, time and tool identities so the analyst can evaluate the intended population instead of reverse-engineering it from an average.
NIST also discusses uncertainty in estimated indices and approaches for non-normal data. Request an appropriate confidence statement, not just extra decimal places. Do not translate an index into a reject-rate promise without checking the underlying model. If only pass/fail observations exist, do not manufacture numerical diameters to feed a normal capability calculation. Agree a suitable analysis for the actual data.